Litplus Creatives

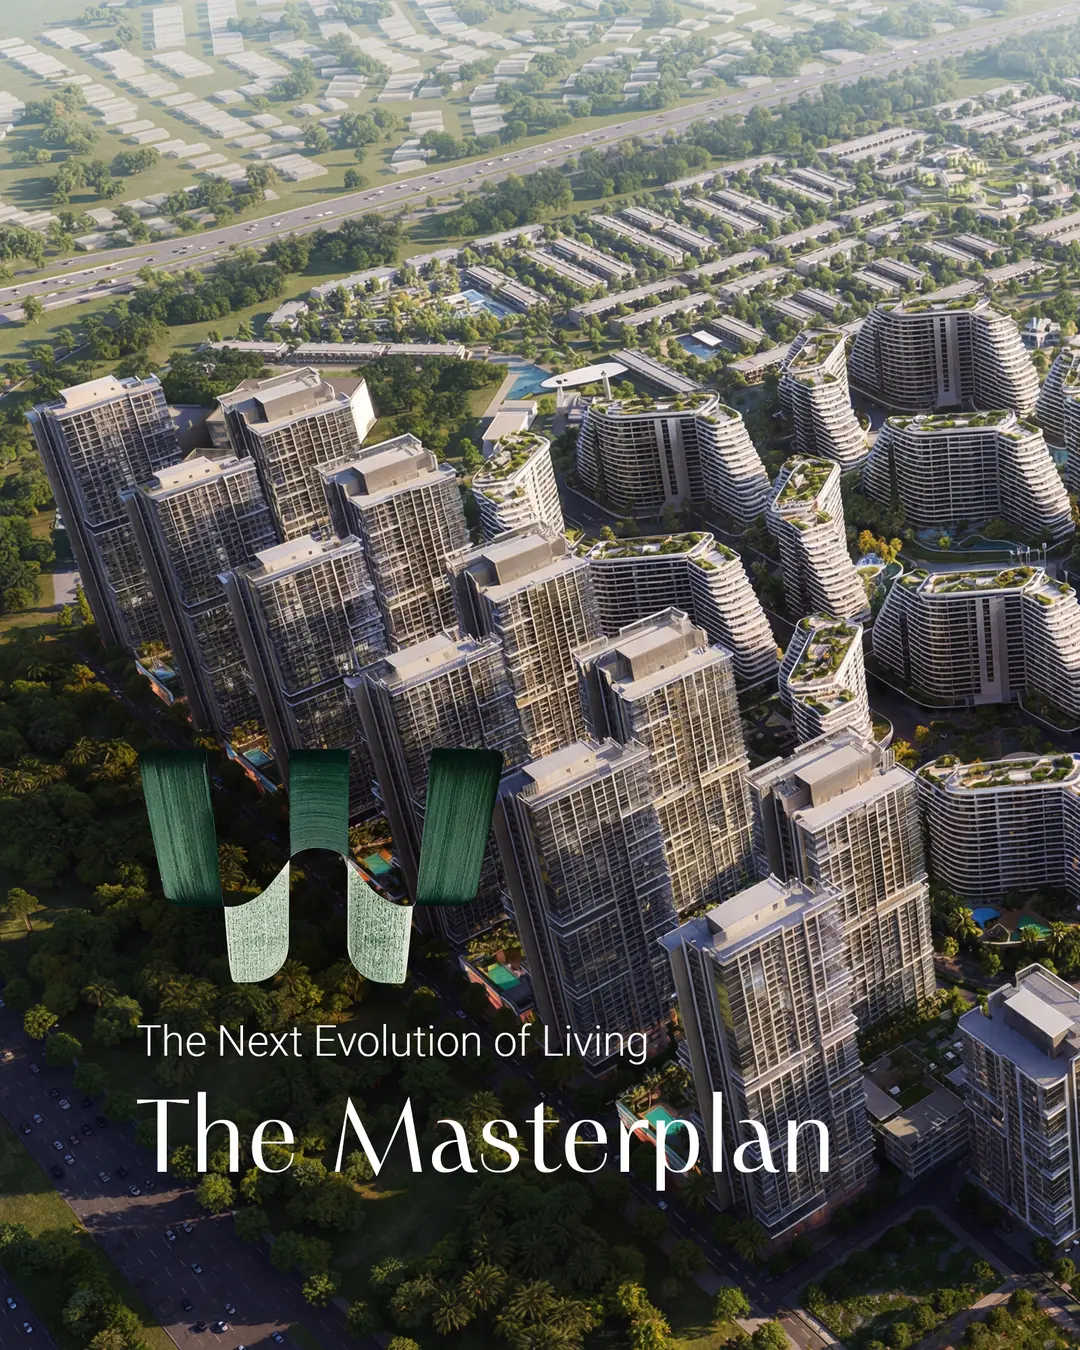
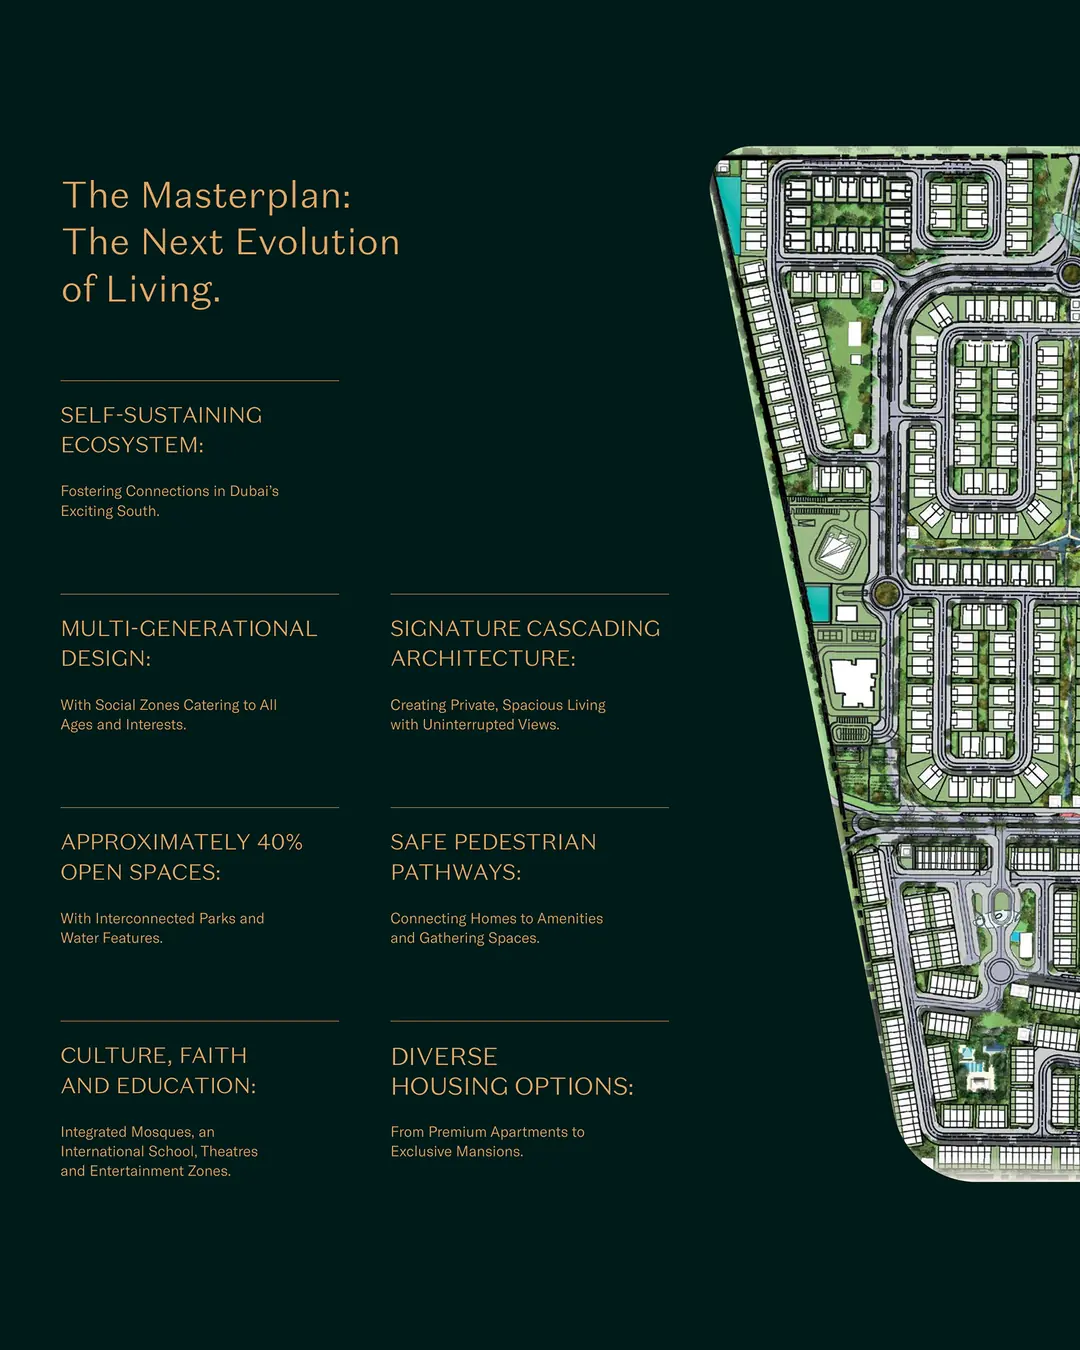
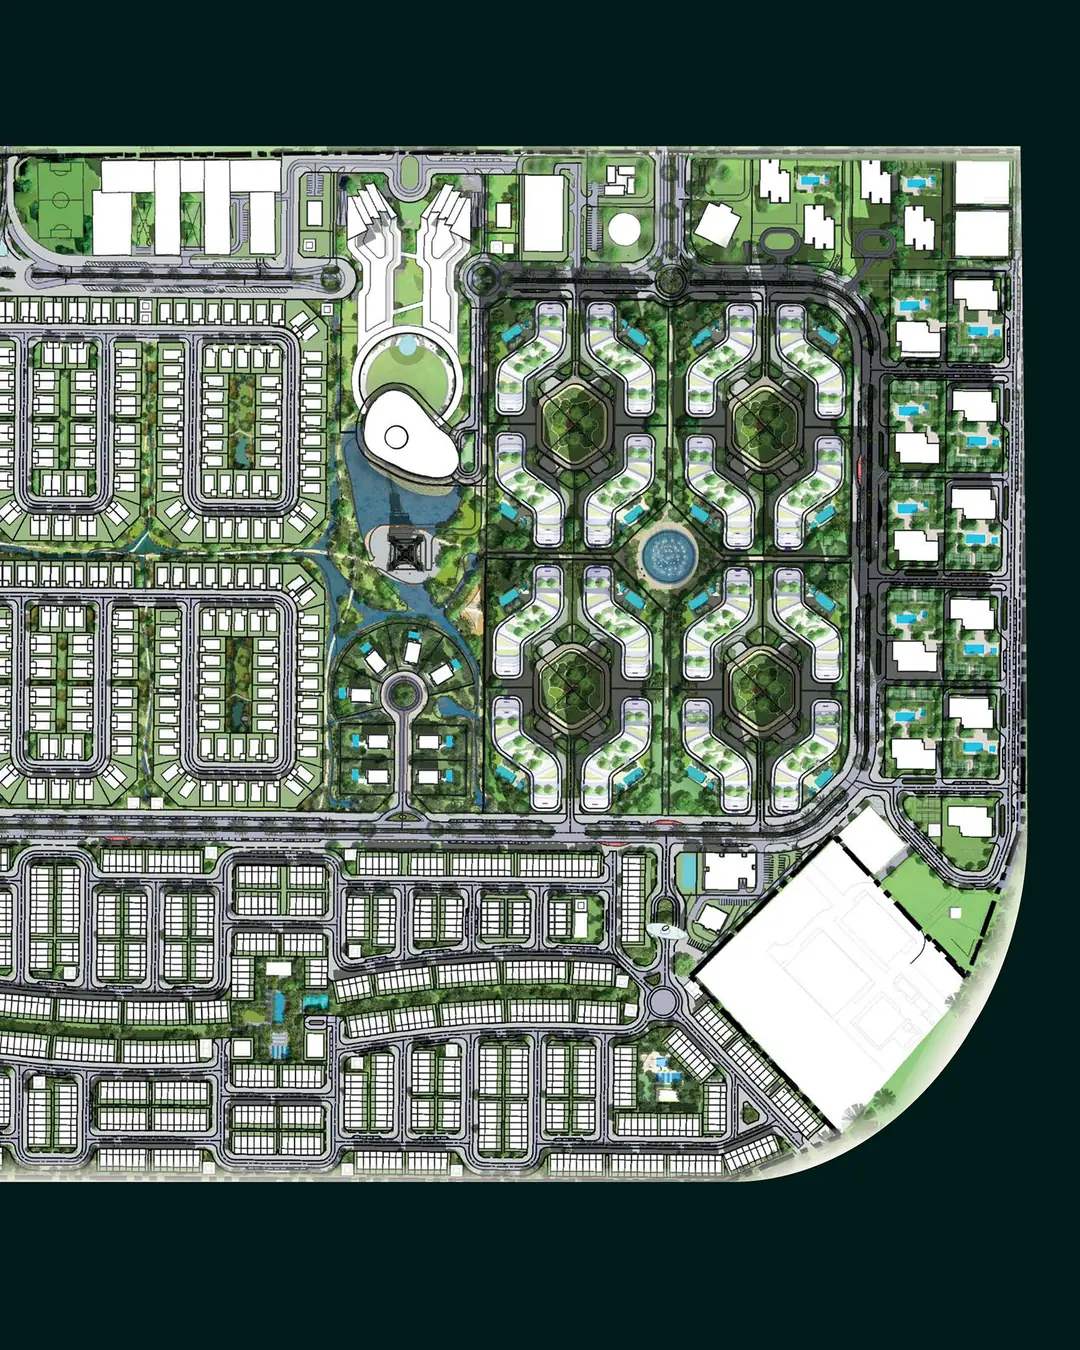
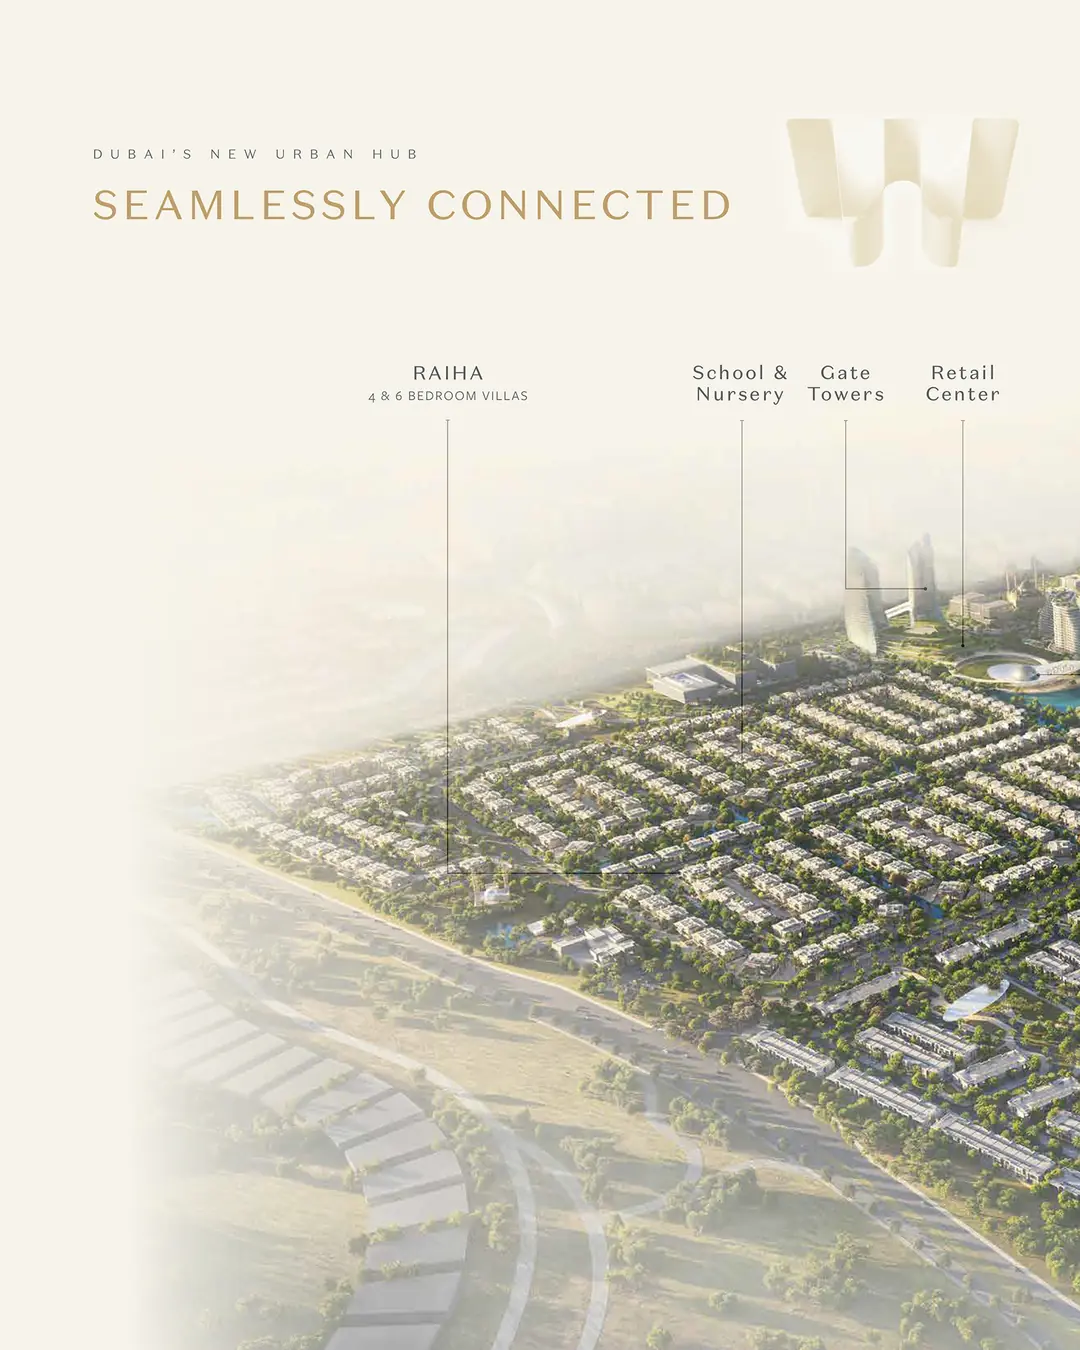
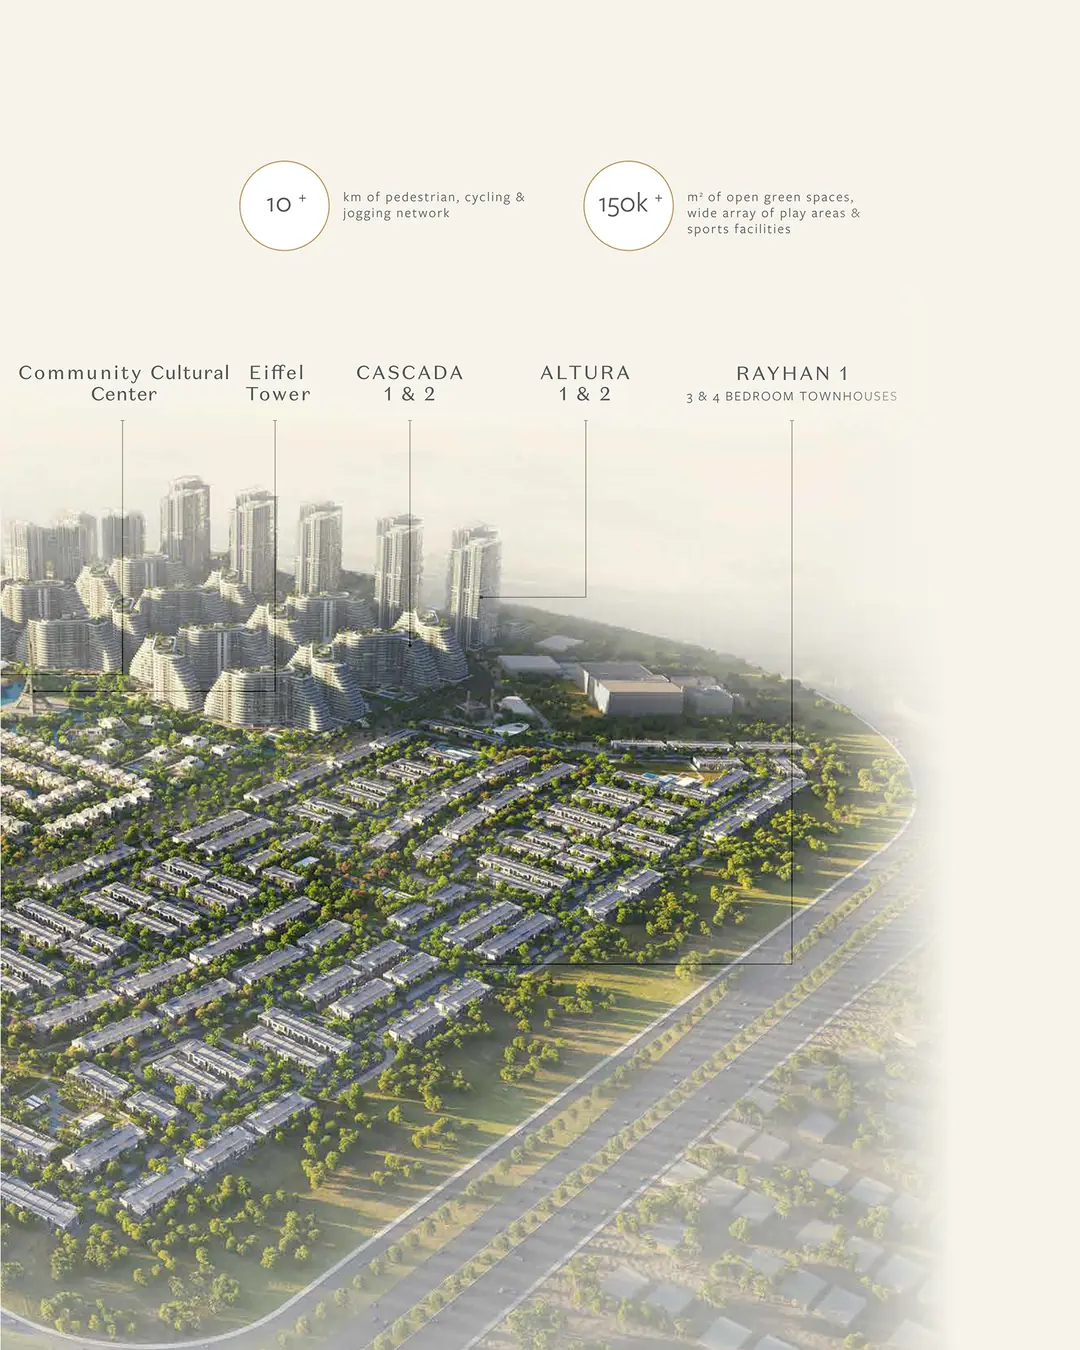
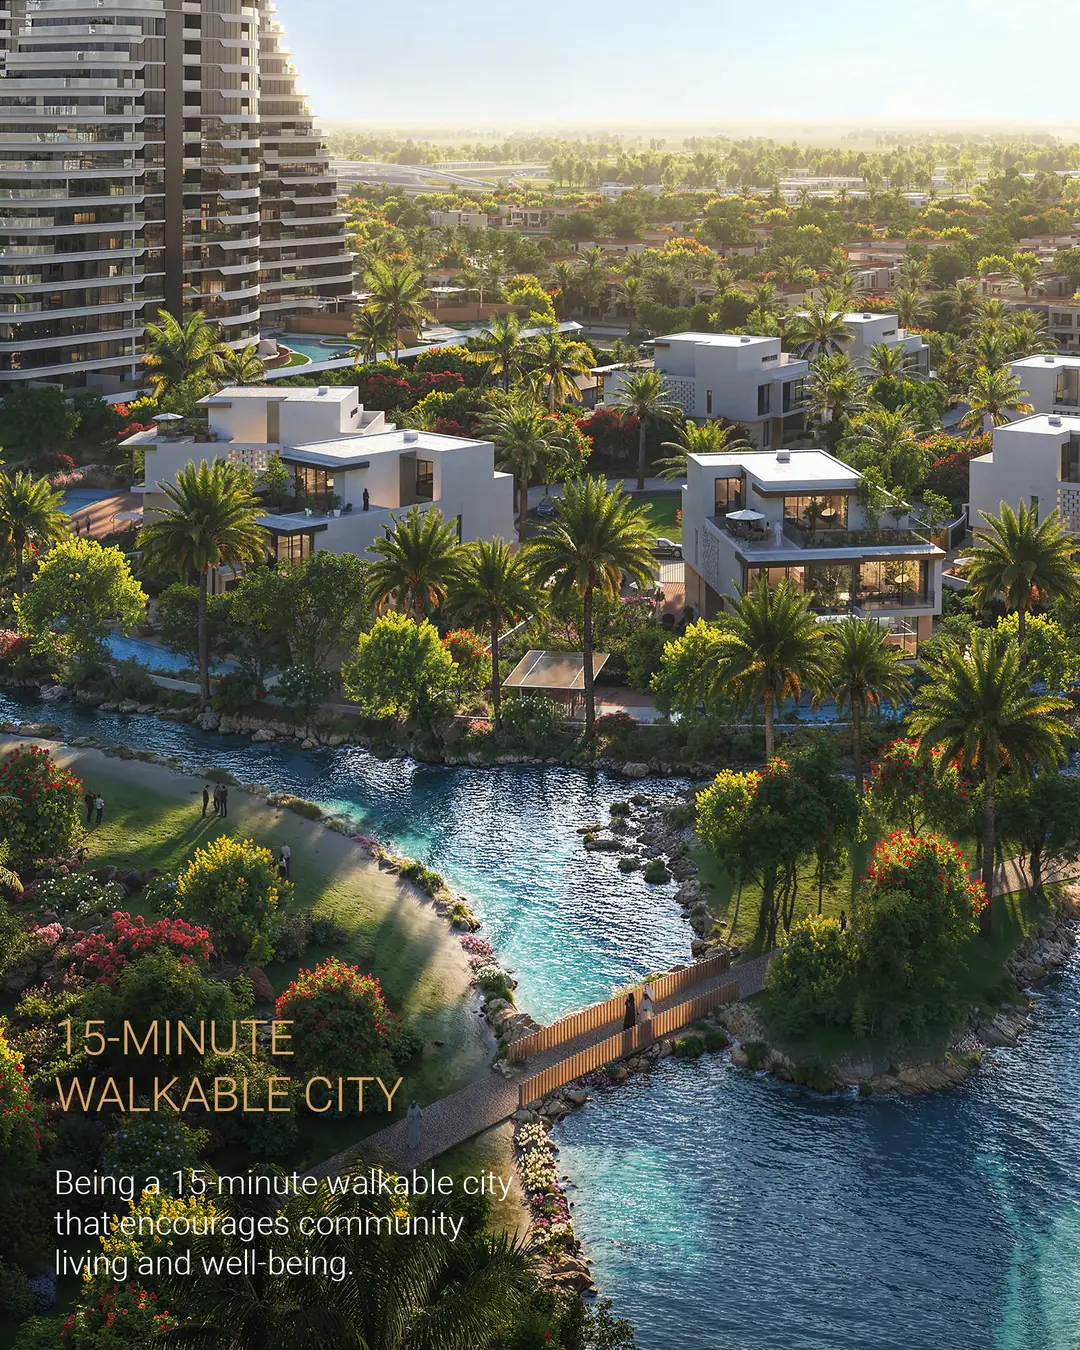
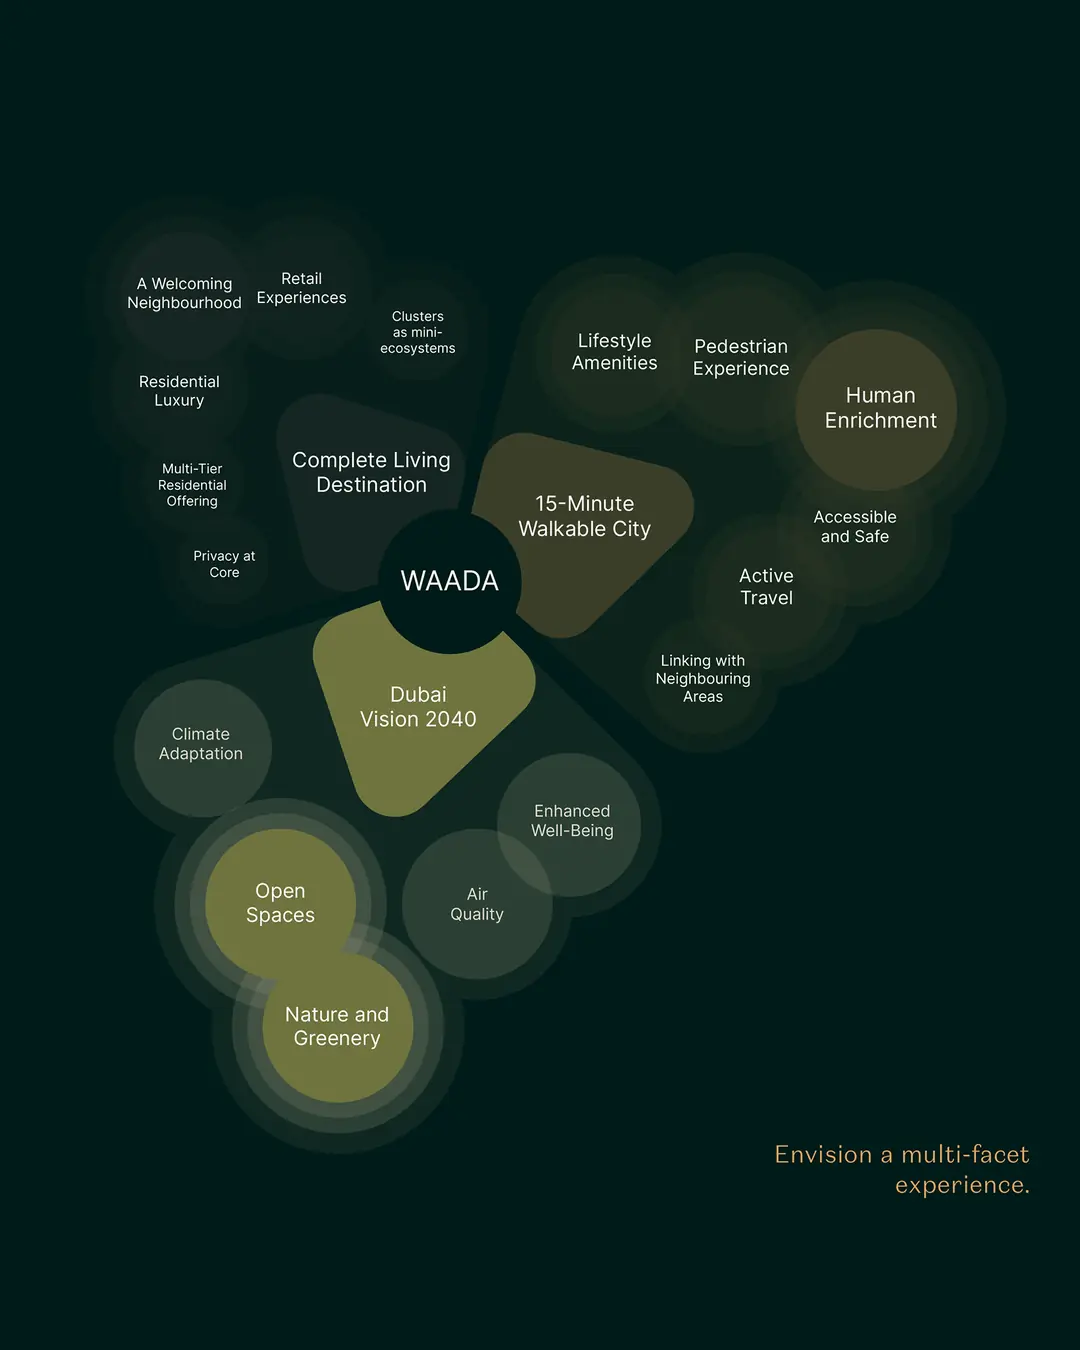
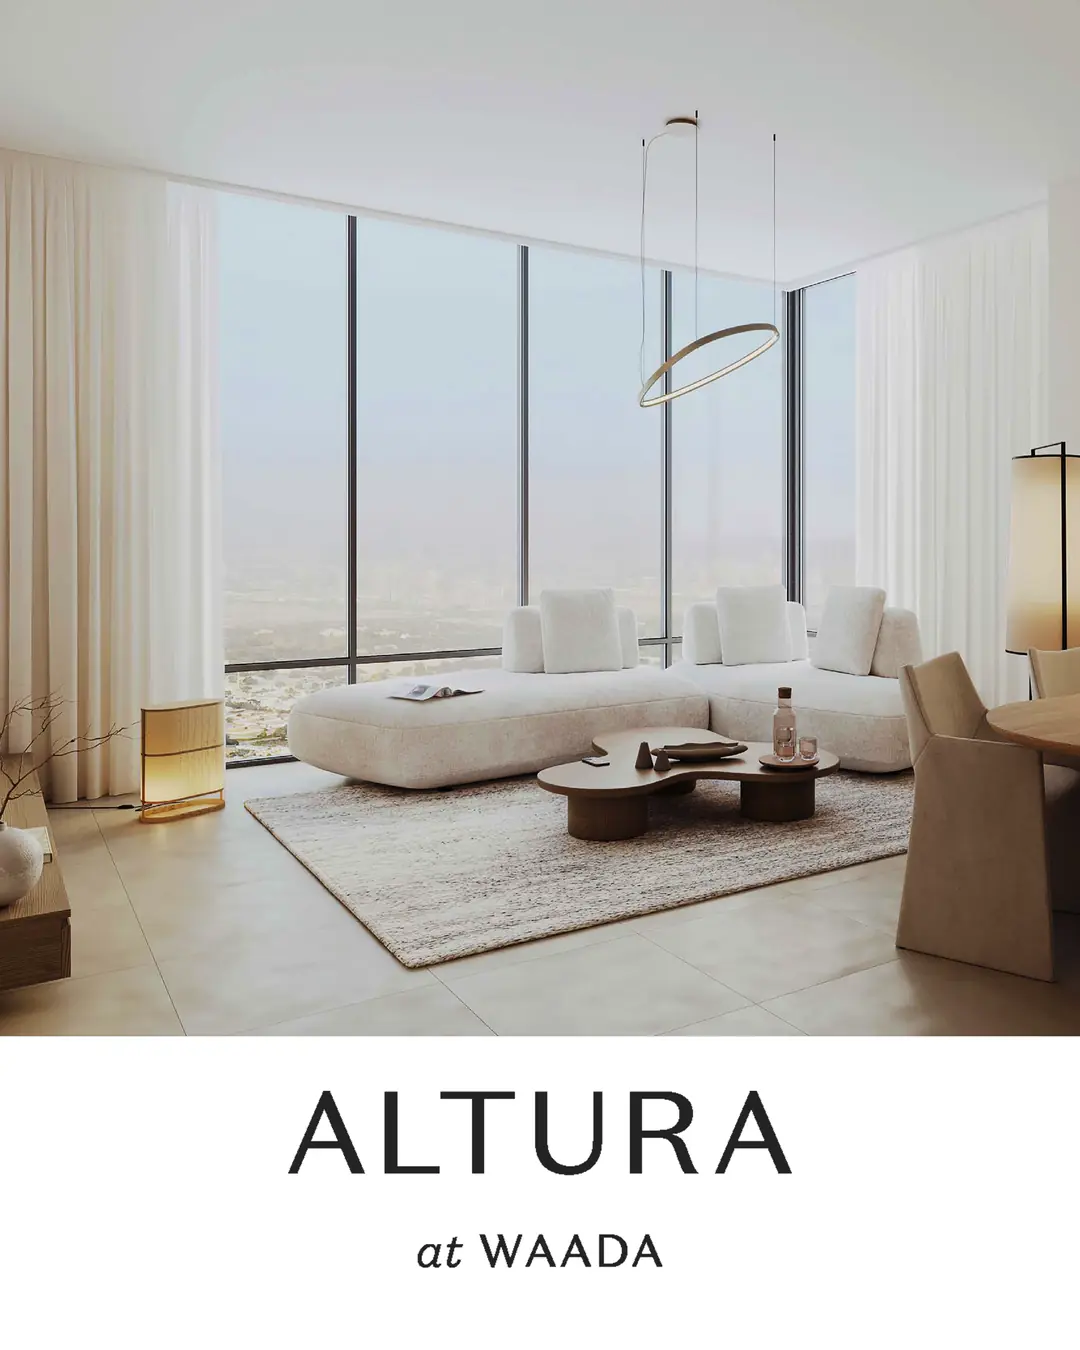
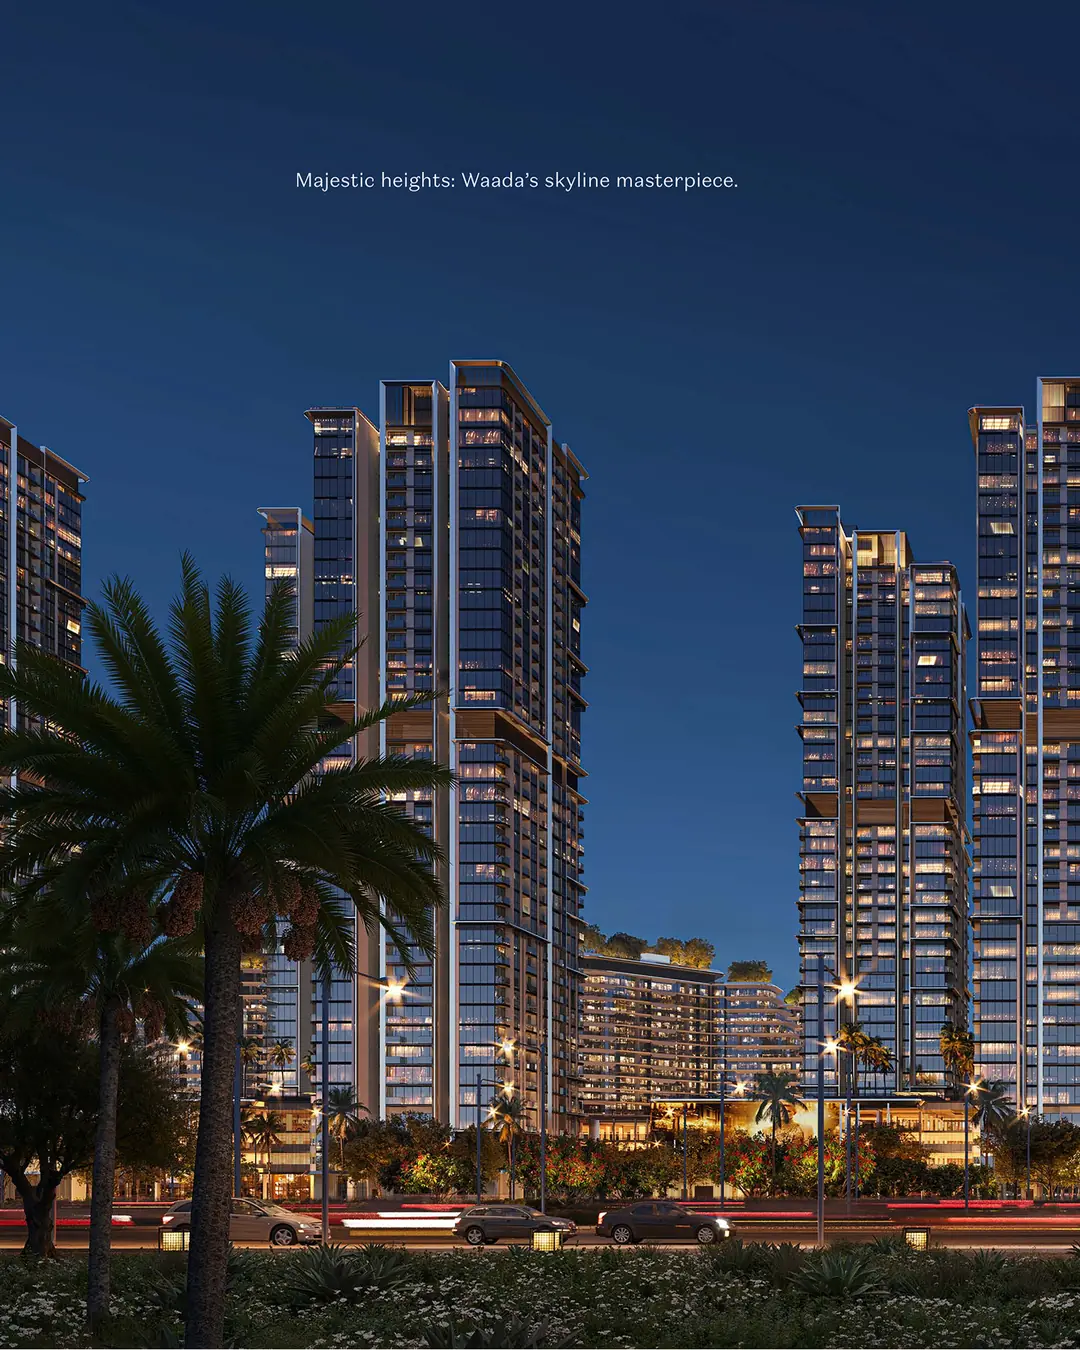
Waada by BT Properties

Redefining sales intake with media and real estate lead generation

VENTURE BUILDING
E-COMMERCE
DELIVERY LOGISTICS MANAGEMENT
PERFORMANCE CREATIVE
PERFORMANCE MARKETING
SOCIAL MEDIA MANAGEMENT
SOCIAL MEDIA MARKETING
INFLUENCER & TALENT MANAGEMENT
PRODUCT INNOVATION
CUSTOMER RELATIONS
PRODUCT PRODUCTION MANAGEMENT
SUPPLY CHAIN MANAGEMENT
FINANCIAL MANAGEMENT

Real estate lead generation for Waada by BT Properties began as a mission to fix a broken sales pipeline. Leads were already being generated, but the internal feedback was that too many were not serious buyers, which wasted the sales team's time. We treated the entire buyer journey, from the first social media impression to the final sales call, as one connected operation. Over five months, $510,694 in net ad spend generated 24,200 leads, 363 confirmed bookings and $172,128,792 in gross sales volume.

The campaign moved 25% of all leads into marketing-qualified status, 20% of those qualified leads into meetings or property viewings, and 30% of those viewings into confirmed bookings. This produced a 1.5% blended lead-to-booking rate, a $1,406.87 cost per booking and a gross return on ad spend of 337x. After the net sales adjustment, realized sales revenue stood at $165,243,640, equal to a 323.6x net ROAS.

Our solution also relied on a full-scale content production engine and advanced search strategies. We moved away from standard brochure-style communication and organized information around how buyers actually research property. By placing proof before contact and connecting campaign feedback with sales follow-up, we improved the quality of the conversations reaching the sales team and created a repeatable framework for future property launches by the same developer.
The Hard Data ● CLIENT-VERIFIED METRICS
Key Metric
Result
Gross Sales Volume Generated
$172,128,792 337x GROSS ROAS
Net Sales Revenue Realized
$165,243,640 323.6x NET ROAS
Confirmed Bookings
363 Units IN 5 MONTHS
Total Net Ad Spend
$510,694 AED 1,875,500
Average Property Price
$474,184 AED 1,740,000
Cost Per Booking
$1,406.87
Blended Cost Per Lead
$21.11 AED 77.50
Ad Spend as a Share of Gross Sales
0.29%
Campaign economics

High-value property sales at controlled acquisition costs

Total Leads 24,200 FULL CAMPAIGN INPUT
Lead-to-Booking Rate 1.5% 363 CONFIRMED BOOKINGS
Blended CPL $21.11 AED 77.50 PER LEAD
Cost Per Booking $1,406.87 ON A $474,184 AVERAGE UNIT
Marketing Funnel Progression 1.5% LEAD-TO-BOOKING
24,200 Total Leads 100% campaign input
6,050 Qualified Leads 25% of all leads became MQLs
1,210 Viewings / Meetings 20% of MQLs progressed to a viewing
363 Confirmed Bookings 30% of viewings converted into bookings
Channel Performance META VS GOOGLE

Meta Ads (Instagram & Facebook)

70% OF BUDGET
Net Spend $356,956
Spend in AED AED 1,312,850
Leads 20,167
Bookings 242
Lead-to-Booking 1.2%
Cost Per Lead $17.70 / AED 65
Booking Share 66.6%

Google Ads (Search & Performance Max)

30% OF BUDGET
Net Spend $153,738
Spend in AED AED 562,650
Leads 4,033
Bookings 121
Lead-to-Booking 3.0%
Cost Per Lead $38.12 / AED 140
Booking Share 33.3%
Month-by-Month Performance 5-MONTH CAMPAIGN
Month Campaign Phase Leads Generated Bookings Closed
Month 1 Momentum 5,000 48
Month 2 Ramp-Up 5,800 82
Month 3 Peak Performance 6,200 105
Month 4 Tapering 4,200 70
Month 5 Finalization 3,000 58
Total 5 Months 24,200 363
Operating variables

The campaign depended on more than media buying

Sales follow-up speed, creative fatigue and the price of the promoted inventory materially changed campaign efficiency.

Under 5-Minute Follow-Up

The CRM response-time standard was under five minutes. Delays beyond five minutes increased cost per lead by approximately 40%.

3x Lead Requirement

When follow-up was late, the sales team needed approximately three times as many leads to create the same sales opportunity.

10–14 Day Creative Cycle

Creative was refreshed every 10 to 14 days to manage fatigue and maintain response quality across paid social campaigns.

$125,000 Entry Point

Waada's entry-level inventory started at $125,000, giving the campaign a wider acquisition pool than the premium inventory.

$1.6M Premium Villas

Premium six-bedroom villas started at $1,600,000 and required a narrower, higher-intent audience.

$45 Premium Villa CPL

As unit value and buyer qualification requirements increased, cost per lead for premium villa inventory scaled to approximately $45.

What We Got Wrong

We should have allocated more budget to Google Ads.

The campaign began with a 70% allocation to Meta and 30% to Google. This split followed the client's original preference, and we agreed to execute it. We therefore own the decision as part of the campaign. As more booking data became available, both we and the client realized that the allocation had been a mistake.

Meta produced cheaper leads at $17.70 each, but only 1.2% converted into bookings. Google leads cost $38.12, but 3% converted into bookings. Google therefore converted leads into confirmed sales at 2.5 times Meta's rate, despite receiving less than half as much budget.

We should have shifted a larger share of spend to Google earlier. The mistake was not using final sales quality aggressively enough when deciding where the next portion of budget should go. A heavier Google allocation would likely have produced more confirmed bookings from the same total spend.

The Process

01. Sales Intake Correction

We redesigned how leads were framed so stronger buying intent reached the sales desk and fewer unqualified inquiries consumed the team's time.

02. AEO & SEO Integration

We optimized the digital footprint for search and Generative Engine Optimization so the brand could be discovered across conventional and AI-assisted research journeys.

03. Full-Stack Content Production

Our team produced eight monthly articles, scripts for short- and long-form video, social media captions and carousel copy.

04. Short-Form Discovery

We created mobile-first property teasers for Reels, Stories and TikTok to generate high-volume discovery through modern feed pacing.

05. Social Media Management

We maintained the ongoing social presence and used Q&A stories and polls to separate family-user interest from investor interest.

06. Social Proof Strategy

We used influencer tours, honest impressions and language-specific creator walkthroughs to build trust across different buyer groups.

07. Documentation Logic

We replaced the traditional “DM for details” flow with self-contained carousels and pages that placed proof before contact.

08. Paid Media Execution

We managed $510,694 in net spend across Meta and Google to generate 24,200 leads and maintain consistent market participation.

09. Strategic Intent Filtering

We used live inquiry patterns, CRM response data and sales feedback to refine content order and improve buyer readiness before the sales conversation.

We’d love to partner with you and your team.

All prospective clients go through a discovery call before receiving a proposal. We then onboard a senior team that implements quick wins while prioritizing larger KPI’s based on realistic outcomes.

Book a Call